The Path to Immunity
Historical trends show there are different challenges to getting shots in arms, depending on where people live.
On Feb. 24, Surgo Ventures unveiled a data tool: The U.S. COVID-19 Vaccine Coverage Index to track major barriers in getting people vaccinated.
The index was created to assist federal, state and county decisionmakers in identifying which communities face challenges to vaccine coverage and why, based on the community-level barriers affecting COVID-19 vaccine uptake.
The index captures 28 supply and demand factors through five different themes. Surgo’s news release said the index’s modular design helps contextualize vaccine rollout performance and highlight inequities across communities – helping keep a pulse on the pace of efforts to ensure equitable, efficient vaccination.
This map shows counties with the highest and lowest levels of concern of distributing the vaccine to its population, according to the index.
Click on the map to go to the site and see how each county compares.
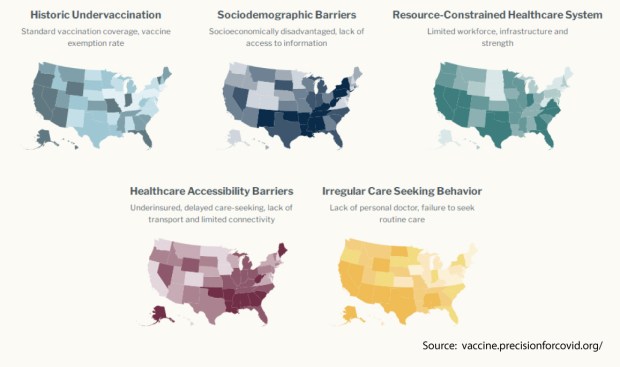
The five themes that make up the index are:
- Historic under vaccination
- Socio- demographic barriers
- Resource-constrained health systems
- Healthcare accessibility barriers
- Irregular care-seeking behavior
According to the index, the following states are the highest concern when it comes to ensuring widespread vaccine coverage:
- 1. Nevada
- 2. Mississippi
- 3. Oklahoma
- 4. Texas
- 5. Georgia
- 6. Arizona
- 7. Arkansas
- 8. Indiana
- 9. Florida
- 10. Tennessee
These maps show several challenges in each state:
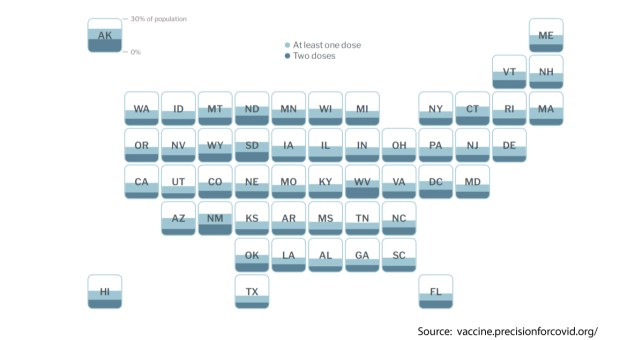
Here’s how the rollout is going in each state, according to the index:
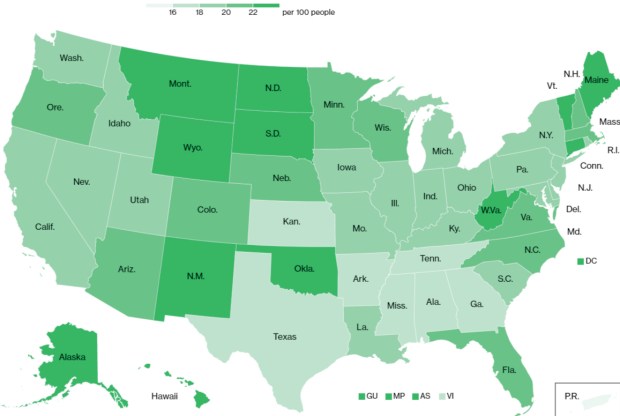
U.S. rates
In the U.S., the latest vaccination rate is 1,275,497 doses per day, on average. At this rate, it will take an estimated nine months to cover 75% of the population with a two-dose vaccine.
Across the U.S.
As of Feb. 24, 44.5 million people have received at least one dose. At least 19.9 million people have completed the two-dose vaccination regimen.
And, 19.6 doses have been administered for every 100 people, and 79% of the shots delivered to states have been administered.
According to Bloomberg, the first stage of the U.S. rollout fell short of federal projections as vaccinations proceeded unevenly across the states. After focusing first on hospitals and other institutional health-care settings, the next phase of vaccinations will draw more on pharmacies and health clinics.
California has the highest daily rate of doses given at 209,334. Florida has the second-highest rate at 115,287.
You can visit the Bloomberg site for daily updates on vaccination progress.
